








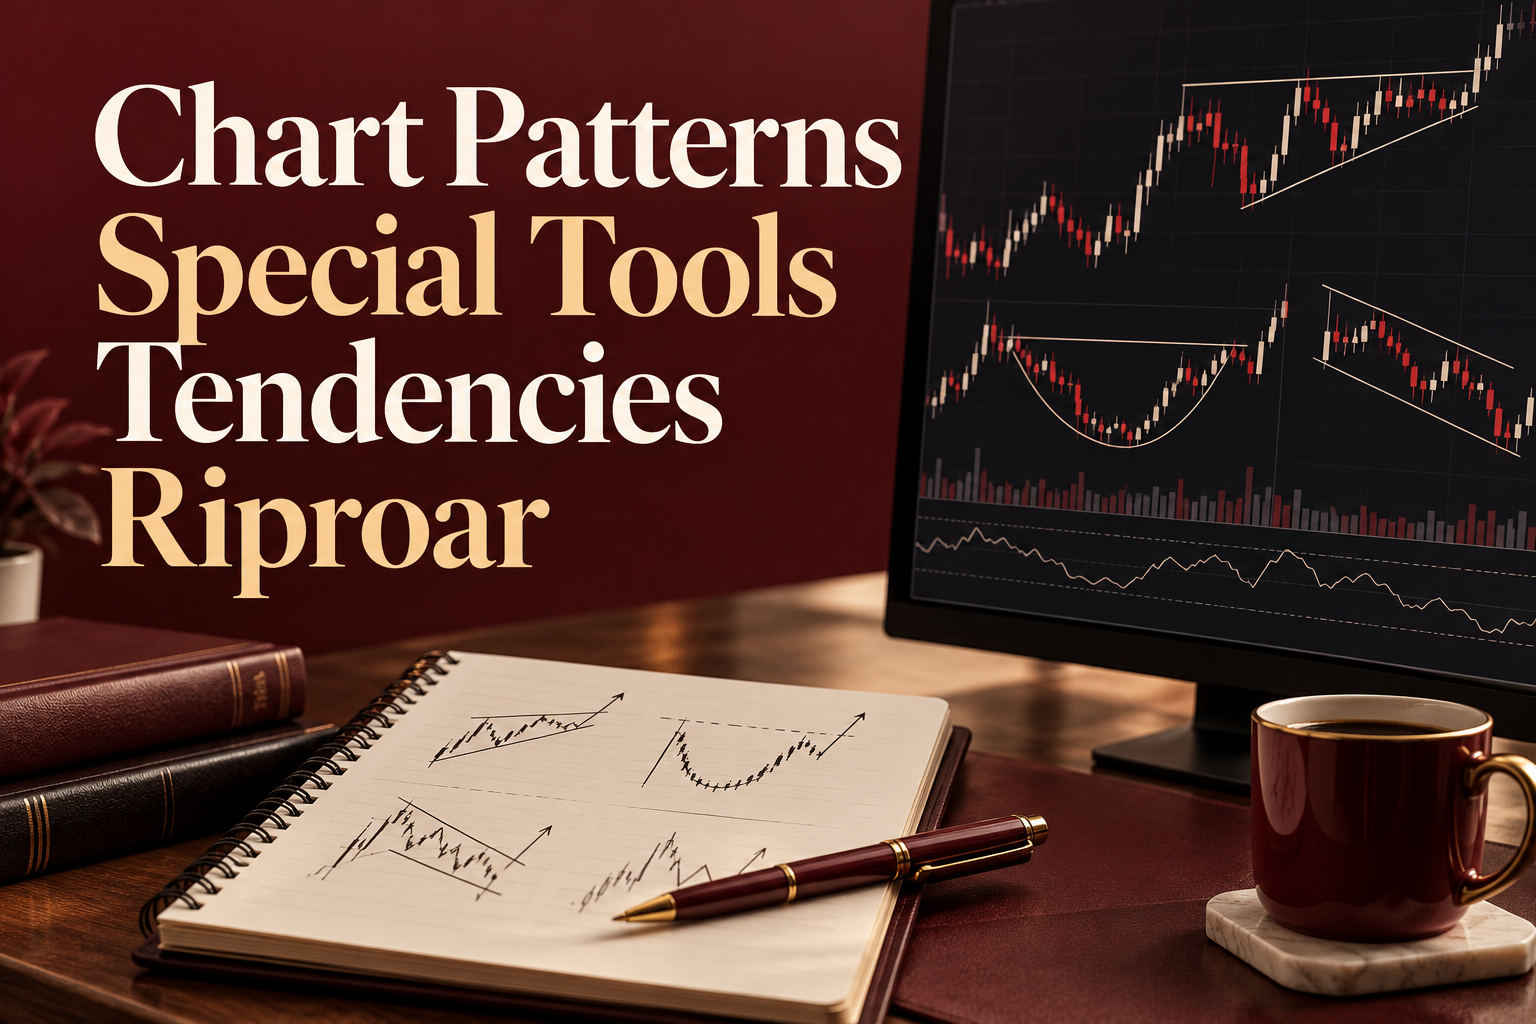
Chart Patterns Special Tools Tendencies Riproar explains how traders describe recurring price formations, which tools help examine them and why apparent tendencies are not guarantees. A pattern is a hypothesis about market behavior that must be defined and tested, rather than a reliable prediction by itself.
Understanding Chart Patterns Special Tools Tendencies Riproar
A chart records price information over a chosen interval. Analysts may describe ranges, triangles, flags or reversal formations when particular arrangements appear. The same price history can look different on another timeframe, so record the instrument, interval and rules before interpreting a shape.
Kraken’s educational explanation of chart patterns discusses identification, invalidation and false breakouts. It also notes that a pattern’s usefulness depends on context and testing. An exchange’s educational material is a description of techniques, not independent proof that a method will make money.
Use tools to make observations repeatable
Trend lines help describe a boundary, while horizontal levels mark areas an analyst wants to monitor. Volume data can provide another view of activity, subject to the coverage and quality of the source. Indicators are calculations based on selected data and settings; adding more of them does not automatically create independent confirmation.
Save the original chart and write down the rule before the outcome is known. A hypothetical rule might require a closing price beyond a defined range rather than any brief intraday move. This makes later review more honest than redrawing the boundaries after seeing what happened.
Test tendencies without selecting only successful examples
Apply the same rule across a defined sample and include failed cases. Separate the data used to develop an idea from the data used to evaluate it. Repeatedly changing the rule until past results look attractive can produce a strategy tailored to history rather than a repeatable approach.
Include transaction costs and plausible execution differences. In an illustrative test, a small apparent gain per trade can disappear after spreads and fees. Results also need to be interpreted against the amount and variability of risk, not just the percentage of trades that finished positive.
A chart signal does not solve execution risk
A breakout can reverse, and a planned exit may not execute at the expected price. The SEC’s order-type bulletin explains important differences between market, limit and stop instructions. Learn the actual behavior offered by the broker before relying on an order as a risk control.
Keep chart study separate from money needed for ordinary obligations. If a pattern cannot be defined clearly enough for another person to identify it using the same information, its apparent success may be subjective. Treat uncertainty as part of the analysis rather than searching for a tool that promises to remove it.
Frequently asked questions
Do chart patterns guarantee a direction?
No. Formations can fail, reverse or be interpreted differently.
Which charting tool is essential?
A reliable data source and tools that support repeatable rules matter more than a large indicator collection.
What is a false breakout?
It is a move beyond a perceived boundary that reverses rather than sustaining the expected direction.
Why include fees in testing?
Costs reduce results and can eliminate a small apparent advantage.
Sources
Related reading
Rprinvesting Trading Guide by Riproar; Rprinvesting Exchange Guide from Riproar.